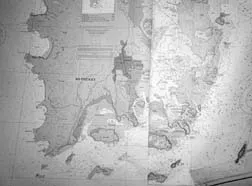
My youthful infatuation with maps has a lot to do with the fact that we are now aboard a sailboat almost halfway around the world from our homeport of Newport. As a child, I spent hours poring over maps, charts, globes, trying to imagine faraway places from two-dimensional images. The walls of my bedroom were always covered with maps—a little strange for a child of 10, perhaps.

During the decade that Calypso took shape in my backyard, the walls of my bedroom were still covered with maps, although by now they had a purpose. I would go to bed facing charts of the South Pacific, and they helped maintain a dream during the hard years when it seemed the boat would never be finished.
Now, I pore over charts with a different purpose: to figure out where we are, where we are going, and how I can get there without running into hard objects that are less than 7 feet below the surface!
Charts are a major expense for the cruising sailor. The 200-plus charts that we have on board now cover our routing from New England to the eastern Mediterranean via the Caribbean, the South Pacific, Southeast Asia, the Indian Ocean, and the Red Sea. Conservatively, they represent an investment of about $3,000.
The worst values in original printed charts are the famed British Admiralty charts. Yes, they are nicely printed and easy to read, but the paper has become thin almost to the point of flimsiness. At about $30 each, they are staggeringly expensive.
At the other end of the spectrum are the Royal New Zealand Navy Hydrographic Office charts. Beautifully printed in four colors on very heavy paper, they are a bargain at just under $10 each, thanks to the weak New Zealand dollar. On the downside, they cover only a limited area—New Zealand, and the western South Pacific island groups of Tonga and Fiji.
Charts published by the Hydrographic Service of the Royal Australian Navy are somewhere in between in value. Printed on lighter paper than New Zealand charts, they cost about $15 each, and cover Australia and adjacent waters.
Some of the most interesting charts we have are published by the Hydrographic Office of the Royal Thai Navy, covering southern Thailand and its Malaysian approaches. Details are given in both Thai and English, and the data comes not only from Thai surveys, but from those conducted by the Japanese in 1942, when they occupied most of Southeast Asia. Well-printed on heavy paper, they are a bargain at about $6 each.
Most of our charts, however, are American charts from NIMA (National Imagery and Mapping Agency, the successor to DMA-the Defense Mapping Agency). The NIMA catalog covers the world, and covers it very well.
It’s not like our survey ships are poking into harbors around the world, however. Our mapping offices depend on many sources of data, including hydrographic surveys conducted by other countries. For example, NIMA chart 71042, which covers basically the same area as Thai chart 334, is based on exactly the same Thai surveys. NIMA charts of Malaysia utilize British Admiralty surveys. It’s fair to say that Admiralty surveys cover more of the world than those of any other hydrographic office, thanks to the vastness of the former British empire and the preoccupation with hydrographic surveys that is a Royal Naval tradition.
At first glance, NIMA charts are pretty dull and lifeless compared to the colorful charts produced by some other countries. The charts are printed in a limited palette of magenta, gray, purple and blue. Put NIMA charts under red night lighting, however, and they come alive. The muted colors then become easily differentiated shades of gray, and are actually easier to decipher than more colorful charts.
Most NIMA charts are also corrected to the WGS (World Geodetic System) datum, allowing satellite-derived positions (and these are the only positions anyone uses these days) to be plotted directly, without adjustment. By comparison, Thai chart 334 requires shifting positions by up to about 400 meters when using GPS, as do many of the Australian charts we are now using to navigate the east and north coasts of the Australian continent.
Some NIMA charts we recently received are printed on heavy paper, others on lighter stock. NIMA charts also perpetuate the annoying US “standard” of being printed in a variety of sizes, rather than a single format. Calypso’s chart table was built to accommodate unfolded Admiralty charts, but some NIMA charts hang over the edges. This inconsistent size also complicates cataloging and storing, since our chart locker is designed to store charts folded once and stored vertically. The largest NIMA charts block the labels on smaller charts, and the smaller charts get lost between the charts of normal size. Nevertheless, at a list price of $16.50 NIMA charts are still among the best values in the world.
Cheap Solutions
World cruisers are notorious for cheaping out on charts, and for good reason. Original paper charts for a “normal” world cruise will set you back about $5,000. What’s the solution?
For cruisers, by far the most common cost-cutting measure is the use of photocopied charts. US charts, although covered by copyrights, may be legally reproduced, as the US government specifically gives up its copyright protection on charts. British Admiralty charts may not be legally copied…but they are, anyway.
Photocopiers large enough to accommodate charts are quite common everywhere in the world, and cruisers take advantage of it. In New Zealand, friends of ours made a deal with a photocopy shop to do the work themselves, and stop work if the shop needed to use the machine. They ended up paying less than $1 per chart for more than 100 charts—little more than the cost of the medium-weight paper they used.
In many popular cruising destinations, local copy shops sell bootleg copies of charts from any number of countries.
The downside, of course, is that you may be buying copies of charts that are seriously out of date. While this may not matter for ocean charts, the implications for coastal charts can be serious. Lights and buoys come and go, harbors are altered, channels are dredged or silt in. Little compares to the thrill of approaching a difficult harbor with an out-of-date chart, only to discover that important things are now different.
Not all photocopies are bad, however. The Bellingham Chart Printers Division of Tides End Ltd., has been providing high-quality photocopies of up-to-date charts to cruising sailors worldwide for years. Printed on heavy paper—the equivalent of the stock used for many original charts—individual, full-size photocopies sell for $7.75 each. This is less than half the cost of originals.
Even better deals are their photocopied chart portfolios, which include all the charts of a specific region. The 38 original NIMA charts which cover the Red Sea sell for $627. The full-size photocopied portfolio of the same charts goes for $264.
But the best deal of all is Bellingham’s two-thirds size photocopy portfolios. The comparable Red Sea portfolio in reduced size is $188. The smaller photocopy portfolios are conveniently bound together with nylon fasteners that allow individual charts to be removed and re-inserted. The smaller size fits conveniently on many chart tables that cannot accommodate full-size charts.
There is very little loss of detail in the smaller reproductions. The scale does not seem unnaturally small, and they are still easy to read. For world cruisers on a limited budget, they represent an extraordinary value. The smaller photocopies would also make great backups for sailors using electronic charts.
There are two drawbacks to the photocopied portfolios. First, they are likely to include charts you don’t really need. The Red Sea portfolio, for example, contains about 10 charts of the Gulf of Aqaba and the coast of Saudi Arabia, neither of which is usually visited by cruisers. Saudi Arabia does not welcome cruisers.
Second, they are black and white copies. The subtle colors of NIMA originals become even more subtle in the copies, although they are still easy to read. When using photocopies, we go over each chart with highlighting pens to outline dangers that are less obvious in black and white than they are in color. You don’t want to use a red highlighting pen, as the markings disappear under red night lighting.
By carefully going over the NIMA chart catalogs (these are available free from any large chart agent) we were able to pare down our chart requirements to fit our routing, eliminating many unnecessary charts. Our portfolio for the Red Sea includes only 28 charts, and even a few of those—the Suez Canal charts, for example—are really superfluous, because the canal pilot is going to tell you where to go.
Bellingham shipped charts to Australia by FedEx. Shipping cost for 83 charts (including $30 for expedited shipping from NOAA to Bellingham, plus shipping to Australia) was about $195. The price break on originals more than offset the shipping costs.
Our charts got hung up at the Federal Express facility in Sydney, when they decided to charge Australian duty and GST (sales tax) of about $200 on the shipment. I spent an entire afternoon on the phone with various Federal Express departments before getting to the person who conceded that the charts should not be surcharged.
Although there are many NIMA chart agents, Bellingham is one of three US companies we are aware of that have built substantial businesses specializing in shipping electronic and paper charts to cruising sailors anywhere in the world. The other US agents we have used are Armchair Sailor (Newport, Rhode Island), and Bluewater Books and Charts (Ft. Lauderdale, Florida). Only Bellingham Chart Printers, however, also specializes in photocopied charts.
Contacts- Armchair Sailor, 543 Thames St., Newport, RI 02840; 401/847-4252, fax: 401/847-1219, www.seabooks.com. Bluewater Books and Charts, 1481 SE 17th St., Ft. Lauderdale, FL 33316; 954/763-6533, fax: 954/522-2278; www.bluewaterweb.com. Tides End Ltd., Bellingham Chart Printers Div., PO Box 1728, Friday Harbor, WA 98250; 800/643-3900, fax: 360/468-3939, www.tidesend.com.


