For centuries, navigators have been coping with two key variables that convey major consequence. The first is the quest for an accurate position fix, and the second is the hope that the chart they’re using is an accurate representation of their surroundings. Up until a couple of decades ago, cartographers were winning out and chart accuracy trumped sextant-derived fix accuracy. The tide has turned.
Global Navigation Satellite Systems (GNSS) and digital charting are here to stay, and their benefits far outnumber their shortfalls. But they are an aid to navigation, not a replacement for the navigator. Its important to recognize that the relationship between GPS-derived positions and modern cartography is not as solid as it may appear. Gaps in the cartographers global database cause some charts, as well as some parts of a single chart, to be far more accurate than other charts or areas on the same chart. It all boils down to how well and how recently the survey work has been done.
During the 1700s, Capt. James Cook and his crew measured depth with a lead line and took horizontal angle measurements of prominent shoreline features using a sextant in order to position their soundings. His survey work is still in use today. Technology has revolutionized bathymetry, the study of the ocean floor. Single-beam sonar replaced the lead line; GPS more accurately located each sounding. And now with multi-beam and side-scan sonar, survey-ship skippers refer to data gathering as mowing the grass. In essence, the wide-angle sonar captures a whole swath of bottom contour with each pass. And with faster, pulse-rate sounders, survey ships can make 8- to 9-knot runs with GPS-guided tracking. GPS and multi-beam sonar survey work is what it takes to acquire Grade A results.
Unfortunately, deep-draft survey ships arent cut out to survey shoal water. Thats why LIDAR, a benthic-zone survey technique based on remote reading of reflected laser light, is being added to the surveyors arsenal. Its being used on both aircraft and autonomous surface vessels. But the job is far from complete, and thats why every navigator should attempt to pin down how well a given body of water has been surveyed.
The International Hydrographic Organization (IHO) has quantified this variation in chart accuracy using a rating system referred to as the Category of Zone of Confidence (CATZOC). Commercial navigators using the mandatory Electronic Chart Display and Information System (ECDIS) can call up a specific layer on a chart that graphically reveals the survey accuracy of various segments of that chart. This capability is not presently available on digital charts in the recreational market.
In the U.S., the National Oceanic and Atmospheric Administration (NOAA) does include source diagrams depicting the date and methodology of survey work used to compile each chart. Plans are in the works to amend NOAAs chart manual so that in the future, it will better dovetail with the CATZOC profile of survey accuracy. All hydrographic offices around the world recognize the risk that stems from missing or incorrect soundings that are as much of a threat to a sailor as a snow-covered crevasse is to a mountaineer.
Background
For centuries, navigators have valued the treasure stowed in their overstuffed chart table. However, when you step aboard many modern cruisers, the chart table has become an empty warehouse, home only to a handful of electronic cards that secure all the essential cartography. As we’ve said many times before, we are not advocates of the 100-percent paperless navigation station. This remains true, despite the U.S Coast Guards recent acceptance of electronic charting systems to satisfy chart-carriage requirements. (See accompanying sidebar.) Whats front and center now is the role chart scale plays in navigation and how scale and accuracy are indirectly proportional.
We think of larger-scale charts as those covering smaller areas in greater detail, and conversely, small-scale charts cover larger areas in less detail. For example, if we have a small-scale chart, the cartographer has intentionally generalized its detail so clutter does not obscure the most essential bits of information. Minor misplacement of inshore features on a small-scale view is deemed acceptable because these charts are used for passage planning and navigation offshore not for making landfall. But if we zoom in for greater detail on a small-scale paper or raster-scan digital chart, some problems will arise. As we magnify the view, we also magnify any inherent errors.
So, when approaching a landfall or carrying out coastal navigation, larger-scale charts are used because they display smaller sections of a given area and contain greater detail and smaller errors. When using paper charts, you may plan a long voyage on a 1:1,000,000 small-scale (general) chart, sail the passage on several 1:100,000 medium-scale (coastal) charts, and make landfall on a 1:25,000 large-scale (approach) chart. Even larger scale, more detailed views are provided by harbor charts and berthing charts.
The point here is to keep in mind that most modern digital chartplotters, typically with a multifunction display (MFD), allow you to zoom in and out, seamlessly scrolling among large- to small-scale charts. They even let you know when you’re over-zooming on a specific bit of digital cartography. (Over-zooming, in this case, means viewing at a scale that is larger than the published original chart was meant to be viewed.)
What the modern digital chartplotter will not tell you is whether or not the benthic profile was done with multi-beam sonar and highly accurate GPS fixes (enhanced by wide-area augmented signals, known as WAAS) or by a crew sailing before the mast, singing sea chanteys. To get some idea of that information, you need to zoom into the source diagram and take a close look at when the area you are sailing was last surveyed.
Another part of the where-am-I quest traditionally revolved around a three-bearing fix. The landmarks used for taking a fix could be towers and lighthouses ashore or stars in the sky. Such fixes were crowned the gold standard of the navigators art. But today, GPS and a growing array of other satellite-based navigation systems have led many navigators to pawn the sextant and forget where they put their hand-bearing compass. GPS accuracy and reliability are impressive, but this precision ends up being depicted as a blinking cursor on a digital chart glowing on an MFD screen. The graphics on some charts are astounding, but the charts accuracy remains a work in progress. Even if the GPS coordinates youre receiving are perfectly precise, theres still a whole litany of other locational pitfalls that come into play. And solving this chart-based portion of the navigation puzzle involves the effort of government hydrographic offices around the world and a growing private-sector industry involved in producing charts.
Every manufacturer of dedicated GPS/chartplotter equipment builds into its software a signal-quality graphic display. It designates the accuracy of the current GPS fix, indicates when WAAS is operational, and displays numerical references regarding fix accuracy. Many systems provide a reference called the Dilution of Precision (DOP) and portray fix accuracy in feet or meters. For example, its not unusual for a GPS device to indicate that at that given moment, the fix is accurate to within 6 feet. This does not mean that the blinking cursor on the digital chart is accurate within 6 feet, it means that you are within 6 feet of a pinpoint on the GPS-mapped latitude-longitude grid that covers the planet-also known as the graticule. However, cartographic errors, omissions and how the lat/lon graticule aligns with the cartography all conspire to add some small and occasionally not-so-small inaccuracies to the chart. The biggest culprit is too few and/or older, less accurate surveys, most often found in regions where cruisers like to wander, which are often places with no merchant traffic.
State of the Art
Navionics President Giuseppe Carnevalle, an avid boater himself, always has a few sage words of advice to share with recreational sailors. The skipper of an international electronic navigation systems manufacturer, Carnevalles latest advice is a reminder that, less than 10 percent of the seas are charted to the same resolution and accuracy as the moon and Mars, and many electronic charts are simply digital versions of Captain Cooks surveys. Thats one reason that he and others in the digital chart production business have turned to crowd-sourcing as a means of acquiring additional chart data. His SonarChart Live technology allows a sailor to do real-time benthic mapping via their sounder-chartplotter and an iPhone/iPad link.
When it comes to bathymetry in the U.S., the biggest oar in the water belongs to NOAAs Office of Coast Survey. It is the unsung hero of the hydrographic effort and the U.S. governments official keeper of hydrographic records. It compiles RNC and ENC chart data and electronically publishes the U.S. Coast Pilot. Its 1,000-plus chart inventory is free to download, and all of the major digital and paper chart sellers use this free NOAA database as a primary cartography source for the charts of U.S. waters that they sell. In short, NOAA does the heavy lifting.
Like hydrographic offices around the world, NOAAs work is aimed primarily at keeping merchant shipping safe, especially when entering and leaving port. Fortunately, small-craft recreational sailors share the same waters as the shoal-draft industry (tugs and barges) that ply the inshore waters and also need highly accurate charts. This waterborne highway system is constantly shoaling, and charts need to be carefully updated-as do the survey and dredging work carried out by the Army Corps of Engineers.
Retired NOAA Capt. Nick Perugini summed up todays charting challenges. It is difficult to broadly generalize the position and depth accuracy of NOAA charts, he said. If you examine any one of our 1,000-plus charts, you may find depths that originated from pre-1920 lead line and sextant surveys; some measured with single-beam echo sounders; while others were measured by state-of-the-art, multi-beam sonars. You may find all of this information on a single chart.
A nautical chart is an amalgam of information collected from many sources over many years. Survey or source data may have originated from one of many sources, including NOAA field units, the U.S. Army Corps of Engineers, the U.S. Coast Guard, and even professional mariners or recreational boaters. Each of these groups possesses different capabilities to determine position and depth throughout different time periods. Its the NOAA cartographers job to analyze all this information and make it fit together as accurately as possible. Because the source data is not perfect, the charts are not perfect.
Since the late 1990s, NOAA has been conducting full coverage surveys. These surveys use highly accurate GPS positioning with depths determined by multibeam and/or sidescan sonars. The ability to sound the entire bottom has greatly increased chart accuracy. That being said, the vast majority of depths found on todays NOAA charts were collected by lead line or single-beam echo sounder. These techniques only sampled limited profiles of the bottom, so it is left to the surveyor (and mariner) to infer depths between samples. In flat areas, the samples were typically adequate. In rugged or reef-strewn areas, there is typically a higher degree of uncertainty.
Another often overlooked aspect of horizontal accuracy is the fact that virtually all of todays NOAA electronic charts have some connection to paper charts. NOAA initiated its electronic charting program in the early 1990s by scanning all of its paper charts. Before then, all cartographic compilation was performed manually. While cartographers were skilled at manual compilation, the technique was not nearly as accurate as what can be accomplished today using the Geographic Information System (GIS) to compile charts. Any inherent inaccuracies that were in the system in 1990 are carried through to today, unless they have been superseded by newer surveys conducted over the last 25 years. This holds true not only for raster navigational charts (RNCs), but also ENCs, which were first constructed from RNCs.
It is important to note that prior to universal GPS availability (around 1995), charts were not required to possess absolute positional accuracy. Even the most proficient mariners did not have the ability to position themselves with 5- or 10-meter precision. After GPS became available to all mariners, the tables turned. Instead of charts being more accurate than the mariners positioning capability, GPS gave the mariner a higher degree of absolute accuracy than the data shown on charts. For many charts, this situation still exists.
Conclusion
Over the last several-thousand years, sailors have been asking the same two key questions: Where am I, and how much water is under the keel? These queries have driven the evolution of the nautical chart along with the quest for a precise means of fixing ones position. Ironically, each time one takes a step forward, it tests the exactness of the other. Today, our ability to precisely place a dot on a lat/lon grid is far more accurate than our ability to overlay that grid with a digital chart depicting the exact underwater contour of Earth.
To paraphrase Perugini, the source data is not perfect, so our charts are not perfect. And these words of wisdom need to be taken in context. While the U.S. is one of the best-charted nations in the world, our Exclusive Economic Zone covers 3.4 million square nautical miles. NOAA dubs 500,000 square nautical miles as navigationally significant but only about 46,000 square nautical miles have been surveyed with modern full-bottom coverage. So if omissions and inaccuracies are still an issue in our local waters, imagine what lurks in the outlying reefs of Oceania and coastal regions of other off-the-beaten-path landfalls.
The next time you consider weaving your way through a pea-soup fog, digitally dodging surf-swept granite ledges en route to a protected anchorage, ask yourself these key questions. Have I scrolled to the satellite page on my networked GPS and noted the WAAS-enhanced GPS signal accuracy? Did I check the charts source diagram for the date and scope of the survey in the region Im sailing? Have I validated the digital chart data by previously making the approach in good visibility? Do I have a reliable depth sounder and radar, and are there available aids to navigation to double-check what appears on the chartplotter?
Good navigation involves a cumulative approach, not just a steer-to-the-cursor allegiance.
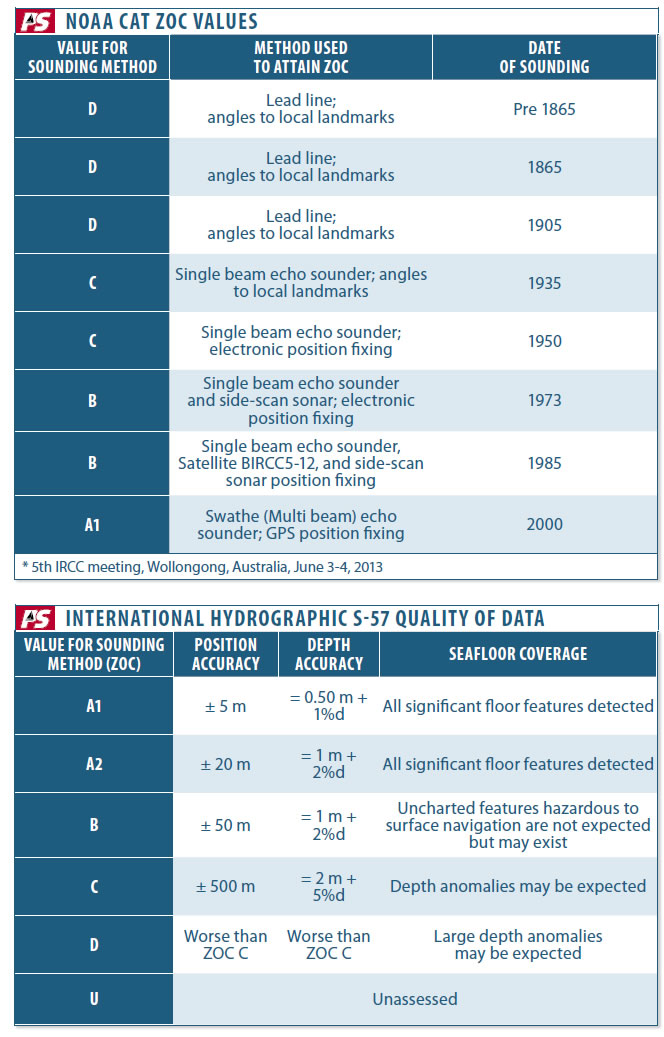
Areas on charts are categorized by their accuracy. One challenge cartographers face is establishing a uniform standard and nomenclature for the Zones of Confidence. In the U.S., NOAA bases its Zones of Confidence on how and when the chart data was collected. In the international realm, the International Hydrographic Office’s S-57 chart assigns values based on the accuracy of position and sea bottom data. The U.S. is gradually shifting toward the universal standard.

A common mistake when using a digital chart is to zoom in for a precise detailed view of an area that was imprecisely charted. Misplaced inshore features on a small-scale chart are deemed acceptable because these charts are used for passage planning and navigation offshore, not for making landfall. But if we zoom in for greater detail on a small-scale paper or raster-scan digital chart, we also magnify any inherent errors.
- Note that the two green markers on this section of the Miles River in the Eastern Chesapeake are denoted as “PA,” position approximate. Mariners would be surprised to learn that even widely traversed corners of the Chesapeake are based on 50-plus-year-old survey data.
- Even the entrance to Annapolis, Md., the home of the U.S. Naval Academy, is surrounded by unreliably charted obstructions. One advantage of digital charts is that they can be decluttered to eliminate extraneous information—although decluttering can sometimes backfire by rendering key data invisible.
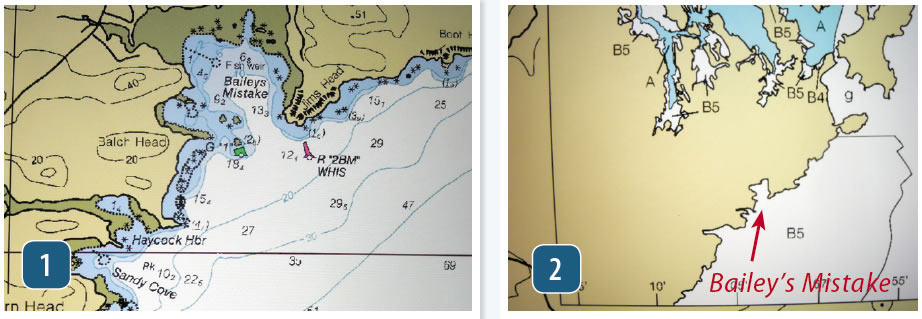
In the early 1800s, so the story goes, a lumber ship steered in fog by Capt. Bailey wrecked near Lubec, Maine, giving the cove “Bailey’s Mistake” its name .
A contemporary sailor could easily make the same mistake by placing too much confidence in the charted data for the area. These types of navigational errors can be avoided by making cautious approaches in areas where the charted areas are based on old survey data that may not be accurate, or may not precisely correlate with satellite-based positions.
- The large-scale chart of the area shows two nav aids at the entrance to Bailey’s Mistake, including a red whistle buoy.
- The chart’s “Source Diagram” designates the area of Bailey’s Mistake as “B5.” According to the chart’s key, “B5” signifies that some survey data was collected before the 1900s.


