


As we discussed in our 2015 report “Dissecting the Art of Staying Upright,” the GZ Curve (at right) can be used to calculate a stability ratio—the area circumscribed in the positive portion of the curve, divided by the area circumscribed by the negative portion of the curve. A higher ratio is better, and a common rule of thumb is that an ocean voyaging boat should have a ratio above 3.0.
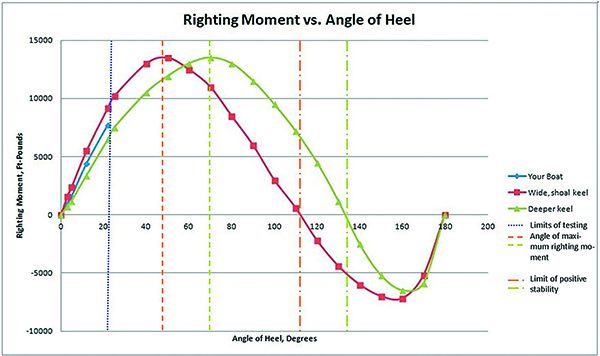
The main article discusses creating a partial table based on heeling angles. Heeling a boat beyond 20 degrees is tricky, but if you can find boats with comparable design features and known GZ-Curves, you can visualize your own righting moment at various angles of heel, or at least roughly check the angle of maximum righting moment and the limit of positive stability. In the example case, “your boat” would likely meet or exceed the minimum LPS we recommend for offshore sailing (120 degrees), but without more information one can’t know for certain.
Once you have collected the data from your boat and other boats, you can create your own table using Microsoft Excel. Here’s how we do it.

- Create a table like the adjacent table with angle and moment in columns. Although we have entered units of measure (ft.-lbs.) do not include them in your table at this time. Place any columns used for intermediate calculations (unit conversions and heel angle) to the right and do not highlight these in the graphing process.
- Highlight and select the cells containing angle of heel, righting moment., and the associated headers.
- Click “insert” on the top tool bar, and then click “scatter” from the graphing options. This will accommodate angles at irregular intervals.
- Click “Design” and a dialogue box will let you chose the title style you want. You will also be able to enter the units and descriptions for each axis.
- You can save the graph as a PDF by selecting the graph and choosing PDF on the “save as” file type menu.


