A couple of years ago, rating navigation programs was much easier than it is today. We were able to downrate programs that were unable to transfer waypoints to or from a GPS, and we could complain about the quality of the charts. But the software has gotten better—a lot better. Now, they’re all capable of downloading coordinates, and most of their charts are clear and crisp to the eye. What truly makes evaluating these software packages difficult is their dizzying array of capabilities: cruise planning, course plotting, chart printing, GPS and autopilot interfaces, float plan preparation, log keeping, tide and current displays, weather displays, vessel equipment operation and maintenance record-keeping, radar overlays, and a host of other bells and whistles. Displays now typically include the capability of showing photos and bottom contour charts (supplied on CD-ROMs).
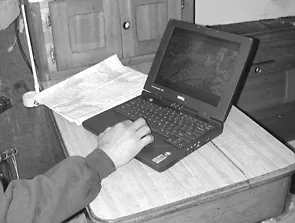
As the feature list fattens, so do the operation manuals: Nobeltec’s Visual Series comes with a 160-page manual, The CAPN provides a 72-page, large-format manual, and MaxSea has a whopping 265-pager. (The CAPN and Nobeltec commendably supply their manuals in printed form with the software package. MaxSea makes you read it from the monitor screen—not a pleasant option for most of us—or print it yourself.)
We had to decide which features and factors are most important to the largest number of our readers. The first question to be answered is where the software is to be used. A computer program requires a computer, and computers—in terms of space available on most boats—are big. Few boats have enough space available at the helm station for even a small laptop. Unless you have a fairly spacious chart table belowdecks, we suspect that the computer may have to live on shore (probably a good idea, anyway, considering the usual effect of salt air on electronics). This means that the computer’s capability of providing a real-time position display is apt to be less useful than its ability to exchange information with a handheld GPS. Happily, recent versions of all the programs we’ve seen do this nicely.
Ability to print clear, detailed charts is desirable. At one time we felt that this was a more important factor than we do now. These programs after all are not intended to replace printed charts, but to supplement them. Clarity of the charts displayed on the monitor is more important, but all that’s absolutely required is sufficient clarity to plan routes effectively—a slightly fuzzier image may be less pleasant to work with, but it’s not a fatal drawback.
What it comes down to, effectively, is convenience and ease of use. Today’s navigation programs are all very capable and can do just about anything that’s demanded of them. The best program is the one that’s the simplest to use and offers the least opportunity for confusion or mistakes.
Raster Charts
Electronic charts—the heart of any navigation program—fall into two general types: raster or vector. They may look similar but are fundamentally different. A raster chart is, effectively, an electronic “photograph” of a paper chart, produced by scanning an existing paper chart or using the same digital data that produces a government chart in the first place. Raster charts are relatively cheap and simple to make, and obviously they’re as accurate as paper charts. They do, however, have some limitations.
A raster chart is made up of pixels, or tiny colored dots. Since any given square inch of a raster chart contains the same number of pixels, whether or not there’s anything of interest in that particular square inch, a raster chart represents a lot of pixels. And since each pixel is a specific bit of information, raster charts require a lot of disk storage space and computer memory to use. Another problem occurs when you zoom in or enlarge a section of a raster chart. The image is enlarged, but the number of pixels is unchanged, resulting in a less-crisp image with fuzzier lines. Then, too, paper charts are not always the same size and orientation, and are drawn to different scales. When you pan to the end of a simple raster chart, you “fall off” the chart’s edge and have to call up the next chart to continue.
Some software designers have addressed this problem through a process called “quilting.” When two charts are quilted, the computer adjusts the size, scale and orientation of the individual raster charts so that they give the illusion of one continuous seamless chart. Quilting is a considerable convenience, especially when you’re working with areas that require moving through several charts. On a long cruise, when you tend to stay on one large-area chart for much of the time, quilting offers no real advantage. Quilting tends to degrade the quality of the chart somewhat, and can slow things down annoyingly if you don’t have a fast computer. In the past, we’ve encountered some strange graphic effects from quilted charts, though we didn’t see any on this round of testing.
Vector Charts
An alternative to the raster chart is the vector chart. Instead of storing the color and position of a vast number of pixels, a vector chart breaks the chart into lines and stores only the beginning, length and direction of the line. Result? Much less information to store. While this compactness was the primary reason for vector charts when storage was limited and computers were much slower than they are now, it’s become a secondary consideration today. While all the information (shapes, aids to navigation, depth information, landmarks, etc.) on a raster chart is fixed on that chart—a pixel doesn’t care what information it’s displaying—a vector chart’s data can be stored and displayed in layers, and only the layers of interest need to be displayed at a given time. Thus, buoy identification labels, which can clutter a chart when you’re trying to study depth contours, can be turned off. The basic shoreline might be in one layer, depth data in another and lights in a third. The improvement in clarity can be impressive.
When you zoom in on a vector chart, there’s no fuzziness or loss of clarity. And when you zoom out, the computer can suppress some of the details that are of importance only in small-area charts. A vector chart can keep text and numbers legible and visible regardless of zoom level and, unlike the situation with raster charts, can keep the text and numbers in the correct orientation no matter whether the chart is viewed in a north-up or a course-up mode.
In theory, at least, it should be possible to have a single vector chart of the world, with the capability of zooming into an area of interest to display as much detail as is required, with no quilting and with a sharp display regardless of zoom level. This hasn’t been achieved yet, though some land-based road map programs have come close. (There’s a much larger potential market for programs aimed at automobiles than there is for those devoted to boats.)
Is there a downside to vector charts? Sure. A vector chart has to be “hand-made.” All of the details have to be selected and placed by humans, using human judgment and skill. Obviously, there’s a great deal of automated work, too, but historically vector charts have varied in quality from abysmally dangerous to very accurate and intelligent. The difficulty has been to know where along that scale our purchases are falling.
The second downside, given all that human labor, has been cost. A vector chart, initially at least, is a more expensive proposition than a raster chart, particularly if it’s a highly detailed one.
We’ve noted some major differences in detail and quality between vector charts supplied with different programs; we’ll point these out in our reviews of individual programs.
Photos/Topo Views
One relatively new trend is the inclusion of photographs (usually of selected harbors) with raster charts. These can provide a reality check on the accuracy of a calculated course.
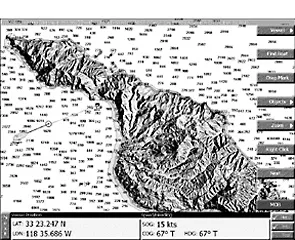
A potentially more useful feature is a graphical representation of bottom contours. What you get is a “wire-cage” representation of the bottom, synchronized with a chart. An icon of your boat moves on the chart and on the contour chart, pointing out when you’re approaching skinny water, or showing you when you’re following an underwater trough or ledge. We suspect that this feature may be of value primarily to fishermen.
What We Tested
We evaluated four programs from three of the major software companies: Nautical Technologies’ CAPN Voyager and CAPN First Mate, Nobeltec’s Visual Navigation Series (6.5 version), and NetSea, Inc.’s MaxSea (8.4 version). We would have tried Maptech’s Offshore Navigator, but the company urged us to wait until an updated version hits the market in March. Expect a review of this program in an upcoming issue.
Throughout our evaluation of these programs, we used Maptech raster charts, which are accompanied in Maptech’s Digital Chartkit with a very basic software program called Chart Navigator. It’s essentially an at-home plotter that can exchange coordinates with a GPS but cannot provide you with real-time GPS position or vessel track. All the others have this capability.
We ran each program through its “normal” paces. We planned trips, developed and stored routes and uploaded waypoints into a handheld GPS. We checked out bearings for the waypoints selected. We checked out tide and current information. We checked out dead-reckoning as a means of planning a course. We modified the routes we developed, adding and moving waypoints. We marked places of interest, set up alarm zones to tell us when we might be approaching a danger spot, and spent a fair amount of time zooming in and out, observing the quality of the monitor display. We printed our own customized charts.
CAPN Voyager
CAPN Voyager is the latest version of a program that’s long been one of the leaders in the field. It has an astounding number of features in addition to a complete navigation and planning package. These include a display of a battery of instruments (depth sounder, anemometer, water temperature and electronic compass), celestial navigation capabilities, maintenance and inventory logs, a world port index, and the ability to import and export tracks. Nautical Technologies, the publisher of the CAPN programs, believes in the accuracy and detail of scanned raster charts and avoids both vector charts and the possible errors inherent in chart quilting.
Chart images are commendably sharp, except for some fuzziness that occurs when you zoom in too far. Chart selection has been simplified by means of an automatic chart selection feature, but you’re still aware that you’re dealing with separate charts. The Coast Guard apparently likes the Nautical Technologies approach: The CAPN Voyager has been chosen by the USCG for use on its vessels.
The CAPN Voyager (CAPN is a cute acronym for Computerized American Practical Navigator) comes with a reasonably clear, well-indexed manual. This is a good thing, not because the CAPN is difficult to use—it isn’t—but because you’re not apt to learn its many features without some guidance. Some features we particularly like are the capability of displaying two different scale charts on a split screen, and of synchronizing the two views. Another neat idea is the ability to use “turn points” as an alternative to waypoints. Turn points don’t have the position labels that waypoints do on your display, and can help avoid a cluttered appearance on the screen or printed chart. They’re particularly handy when plotting a twisty harbor entrance channel with many tight turns.
The CAPN Voyager comes with small-scale charts covering the world and a certificate for a free set of homeport area charts. The program is compatible with most available raster chart formats, including Softchart (a proprietary format), Maptech chart pack, NDI/CHS and Maptech Chartkit (formerly BSB/NOS). The program can also display a graphical representation of bottom contours, obtainable from Softchart. It won’t read the bottom contour and photo displays available from Maptech.
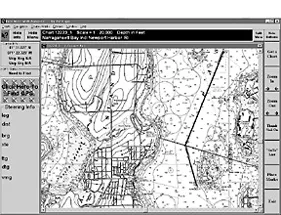
CAPN First Mate
CAPN First Mate is a lower-priced ($199 vs. $495) version of the Voyager that is very similar in operation and appearance, but without some of the Voyager’s more esoteric functions. If you can live without the CAPN Voyager’s graphical instrument display, tide and current displays, alarm zones, celestial navigation features, maintenance and inventory logs and some other advanced features, the First Mate is a first-class navigation program at an economy price. Unfortunately, Nautical Technologies didn’t include the turn point feature, though First Mate does support split screens. First Mate uses the same chart formats as does the Voyager. It can’t handle bottom contours or photo displays.
MaxSea Navigator 8.4
MaxSea Navigator is a navigation program that does many of the same things as the two Nautical Technologies products, but has a distinctive flavor. It’s a fairly straightforward program that’s intuitively simple, trading off some of the features for ease of learning (and remembering). A major advantage, in our opinion, is MaxSea’s quilting feature for raster charts. Moving from one chart to another is automatic, with the program taking care of differing chart scales and orientations. This works quite well, although we encountered a brief pause when we reached the end of one chart before the otherwise seamless continuation to the next chart appeared on our monitor screen.
MaxSea arrived on a single CD-ROM, with no printed manual. There’s a fairly extensive manual that can be downloaded, but downloading is very slow and expensive if you print the whole thing. It took an inkjet printer about four hours to finish the job, at an estimated cost (for ink and paper) of over $13. And what we wound up with was a stack of pages printed on single sides that still had to be punched and bound. We know all about printing costs, but we still think that any reasonably expensive piece of software should come with printed, durably bound documentation, particularly if it may be used onboard.
MaxSea supports a good variety of domestic and international raster chart formats (Maptech chart pack, Maptech ChartKit, Mapmedia, and ARCS) as well as vector charts from C-Map. It doesn’t support photographs, and the version we tested doesn’t support bottom contour displays, although a fisherman’s version of the program does.
The C-Map vector charts provide a clear display that we found to be somewhat cluttered when we zoomed in tight—there’s no “layering” provision to remove unwanted information from the screen. In at least some areas, C-Map large-scale vector charts were less detailed than the corresponding ones from Nobeltec. Raster charts were somewhat fuzzy, though quite legible.
We had some trouble getting MaxSea to work properly on our PC, a Pentium 4 PC running Windows ME, though we’re not at all clear whether the software, the operating system or the computer was at fault. We found MaxSea’s technical support to be very good, though, and MaxSea offers a 60-day free trial, which should be plenty to find out if you’ll have problems. There’s a good demo supplied that walks you through the program’s major features.
Nobeltec Visual Navigation Series 6.5
Nobeltec’s Visual Navigation Series doesn’t restrict itself to unquilted raster charts. You can pick from raster charts (Nobeltec’s RasterPlus, Softchart, NDI or Maptech), Nobeltec’s own vector Passport World charts, and photo and topographic charts from Nobeltec or Maptech. Raster charts can be viewed either quilted or unquilted, and split-screen capability lets you display any combination of chart type or chart scale you choose. You can also display the charts in course-up, north-up or leg-up orientation, which is also possible with the MaxSea and the CAPN products. The Nobeltec program also displays the text and depth numbers right-side up, which you can’t do with the others.
The vector charts used in the Visual Series are a far cry from the crude outline drawings we’ve seen in past programs: They’re crisp, detailed and very clear. They achieve much more of a vector chart’s potential than the C-Map vector charts used by MaxSea, in that land masses, shore and underwater features, soundings, buoys, labels and virtually everything else are in separate layers that can be displayed or hidden in any combination you wish. This versatility is characteristic of the Nobeltec approach. The program provides a lot of tools, and lets you decide how you wish to use them. The chart can be viewed in a choice of color schemes, and with a choice of symbols (ECDIS or NOAA). The result is a truly customizable display. We find the Nobeltec vector charts clear and easy to work with—always keeping in mind the potential for inaccuracies, always keeping paper charts at hand. You can, of course, use the Visual Series with raster charts only, or, for a belt-and-suspenders approach, you could split the screen and show a raster chart in one window and a vector chart in the other. The Visual Navigation Series doesn’t support turn points per se, but it achieves the same goal by permitting you to hide the waypoint labels.
Nobeltec’s program supports both photo and bottom contour displays. If you wish, you can display both, as well as vector and raster charts simultaneously on a four-windowed screen, but this is more of a stunt than a really useful way of doing things. There’s even a “de-clutter” control for soundings so that you can display a smaller number of soundings in a larger font when appropriate. Add to this a full complement of weather, logs, celestial navigation capability, and interfacing options, and you have a system that’s apt to be able to do considerably more than you’ll ever need. As a sort of icing on a many-layered cake, Visual Suite can even be configured to give you audible reports at intervals you select. These audible reports cover time, position, COG, SOG, heading, boatspeed, cross-track error, VMG, time to go, range to active waypoint, bearing to active waypoint, ETA, set, drift, depth, and all sorts of weather information—and you can pick which of these you want to hear.
Conclusions
Any of these programs will allow you to plan a cruise, interface with your GPS, and track your progress if you have a computer onboard. As with all too many things in life, you don’t get what you don’t pay for, and the CAPN First Mate program, the least expensive of the bunch at $199, is also the most limited. It can be a good choice if you’re willing to handle record-keeping chores the old-fashioned way—with a pencil and logbook—and don’t mind dealing with unquilted raster charts.
The CAPN Voyager has the disadvantage of being limited to unquilted raster charts also—no problem on a long cruise, but a nuisance if you’re planning a trip that requires frequent chart swapping. Aside from this, we found little to complain about. The CAPN Voyager is an extremely full-featured, well-documented program and might be the easiest to use for fast plotting underway. That’s probably why the CoastGuard prefers it.
We’d like MaxSea better if we hadn’t had so much trouble running it on our computer. We think that the 60-day free trial period is a great idea, though. We liked the quilting feature and found that it was the easiest of the bunch to learn to use, though it lacked some of the features of the CAPN and Nobeltec’s Visual Navigation Series.
The three testers who worked with with these programs were unanimous about their favorite—it was Nobeltec’s Visual Navigation Series. We were particularly impressed by its flexibility and by the clarity of its vector chart display. Documentation was very good, which is lucky, because there are so many options that it’s difficult to remember them all. Like the CAPN, Nobeltec’s program can do just about anything you’d ever think of asking it to do. We think that Nobeltec’s huge step forward in the use of vector charts makes the program an excellent contribution to any navigation scheme.
Sailors with smaller craft may well find themselves planning their cruises at home or at the dock and uploading the waypoints to their GPS. If this is the way you’re going to operate, many of the advanced features of the CAPN Voyager and Nobeltec’s program will be wasted on you. It may be better to go with the CAPN First Mate or Maptech’s free Chart Navigator.
One last time: Regardless of the temptation to rely entirely on the speed and convenience of any of these programs, remember that they’re intended to be supplements. Paper charts, simple plotting tools, careful observations, and learned skills are at the root of safe navigation.
Contacts— MaxSea, 3821 Falmouth Rd., PO Box 940, Marston Mills, MA 02648-0940; 877/563-1177; www.maxsea.com/. Nobeltec, 14657 SW Teal Blvd., #132, Beaverton, OR 97007; 503/579-1414; www.nobeltec.com/. The CAPN, Nautical Technologies, 381-4 Old Riverhead, Rd., Westhampton Beach, NY 11978; 631/288-0263; www.thecapn.com/. Maptech, 1 Riverside Dr., Andover, MA 01810; 888/839-5551; www.maptech.com/.
Also With This Article
Click here to view “Value Guide: Charting Software.”













need some tech advice on how to transfer info from a max c flsh drive to a simrad unit