Practical Sailor testers surveyed the range of navigation software offerings under $90. Note that none of these programs can use free NOAA vector charts. However, several can use the downloaded NOAA raster charts. The four we tested were Mariner 3.0 www.navgator.com/ , OziExplorer (www.oziexplorer.com/) , SeaClear II (www.sping.com/seaclear/), and Software-On-Board SOBvMAX; (http://www.digiboat.com.au/). Although some of these programs are feature rich, they wont satisfy a yearning for 3D viewing, radar overlays, or photo support, which are available only in the more expensive software.
After our recent test of nine popular navigation software packages (“Nav Software Wars,” September 2006, with updates in April and August 2007), several readers asked Practical Sailorto examine some of the lesser-known free, or nearly free, programs that were not reviewed. If you are planning to buy navigation software, we recommend you read all of the articles in this series before buying.
Practical Sailor
testers surveyed the range of offerings under $100 and narrowed the field to four programs ranging from free to $85. Note that none of these programs can use free NOAA vector charts. However, several can use the downloaded NOAA raster charts (see “Digital Chart
Basics,”).
Although some of the programs are feature rich, they wont satisfy a yearning for 3D viewing, radar overlays, or photo support, which are available only in the more expensive software.
Mariner 3.0
Mariner 3.0, which retails for $70, uses NOAA raster charts and a complete set is included. You can use these same charts with other nav software, if you don’t like Mariner 3.0.
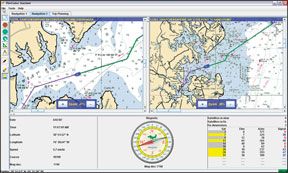
Mariner 3.0 is designed to be simple, but it does incorporate a unique display configuration that is virtually designed by the user. Multiple workspaces, selected from tabs at the top of the main display, can be created and titled when configuring the software. A typical workspace might be set up with one or more chart viewer, a GPS position display, and compass. Others are available, and arrangement is up to the user.
Documentation consists of a help file accessed directly from the program. It details Mariner 3.0s features reasonably well. Support is accessed via e-mail, and our questions were answered in less than 48 hours. The program is basically stable, although rapid scrolling of the chart occasionally caused short pauses in the programs operation.
When you sail off your current chart, Mariner 3.0 selects the best one to use. Occasionally, when crossing the boundary of one chart to the next, both charts were intermittently displayed for a short period of time. Panning and zooming the chart is slow, but functional.
The route creation, planning, and editing functions work, but are not as simple and complete as others in this test. A route can be created and saved by drawing it on the chart display with the mouse. The latitude/longitude of the cursor and the cumulative distance is displayed in the lower corner of the screen, but waypoints are not created, only lines on the chart.
There appears to be no method for measuring bearing and distance between points, but a form of trip planning can be done with the route measuring tool. This basically functions the same way as the route tool, but no information is saved, and the planning route is erased when another tool is selected.
The software effectively alerts users when GPS signal drops out, but other alarms could be improved. Pushing the Man Overboard (MOB) button merely places a mark at the vessels position. No bearing, distance, or steering guidance to the MOB position is available. Cross-track-error and waypoint alarms are also not provided. User marks can be placed anywhere, but cannot be labeled on the chart (although you can enter comments that can be reviewed from a menu selection).
Mariner includes two lower levels of lighting and a choice of screen colors, but these selections affect only the chart display, leaving the rest of the instruments at full intensity&emdash;less than ideal for night sailing.
Bottom Line:
Mariner version 3.0 is quick and easy to install and offers several interesting attributes. In terms of features and performance, however, it falls short of others in this field. A new release is expected to significantly improve routing and planning as well as automatically calculate range and bearing to an MOB position.
OziExplorer
OziExplorer retails for $85. It is available as OziExplorer3D (a viewer that allows map images to be viewed and rotated in three dimensions) and OziExplorerCE (a charting program that runs on the Windows CE operating system used by many handheld devices).
OziExplorer charting software supports a variety of chart formats. Chart images in most common graphics formats can also be calibrated and installed to create your own charts for OziExplorer. Extensive documentation with good coverage is available in the form of a help file, which includes a tutorial with its own demo charts and data. Two questions Practical Sailor sent to OziExplorers e-mail support address went unanswered; a third was answered the next day.
OziExplorers advanced features include the ability to upload and download routes and waypoints with support provided for six popular GPS receivers. Automatic trip logging and a GPS simulator for training are provided, as well as NMEA output for an autopilot. (The Practical Sailor test version was “experimental.”)
When following a route, new charts are loaded automatically when the edge of the current chart is reached. Panning the chart display is done by dragging the chart with the mouse, moving it with the arrow key, or using a mouse scrolling wheel to move the chart vertically. Zooming is done using buttons on the toolbar or from a pop-up menu accessed by right-clicking on the chart display. A right-click on the chart also gives you the option to select other charts for uploading.
Bearing and distance can be measured between a series of points. Leg and cumulative distances are both shown, but if you want a line drawn between the points as they are created, you must turn the line on with another button. OziExplorer gets the job done, but its start-up is less automated than wed like, and you may have to dig a bit before you find what you want. There are a lot of tools offered, but its a big tool box with 36 buttons on the main toolbar and numerous menus.
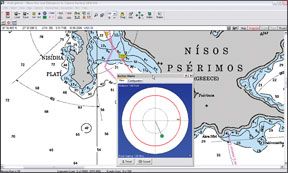
There is no cross-track-error alarm with OziExplorer, but audio alerts are available for waypoints passed, and theres also an excellent anchor alarm complete with a small-scale tracking display and a loud audio alert. GPS input failure warning (a small blinking dot) should be more prominent. When you pass a waypoint, that event is conveniently announced with an audio alert and an onscreen message. Creating your user-defined alarm zones for other functions is possible, but the process is convoluted.
Routes are created using a two-step procedure that begins by selecting the waypoint function with a button and then clicking on the chart to insert waypoints at the cursor position. The ability to add a waypoint by momentarily clicking the mouse is a convenient feature, but inserting a new waypoint into a route involves more work that it should.
An MOB function is available, but the button must be added with the custom toolbar function if its to be readily available at all times. Once the MOB mark has been selected as the active or “navigate to” waypoint on the navigational control panel, range, bearing, and steering guidance is available for returning to the MOB position.
OziExplorer comes with three different screen colors as well as four levels of lighting. But the task bar, window frames, menus, and elevator bars always remain at normal brightness and color.
Bottom Line
: OziExplorer is quite versatile and capable, but requires a fair bit of manipulation to get the job done. It was very stable and performed well with no hang-ups or hesitation. Vector chart support is missing, so users are confined to raster charts, but support is provided for most popular formats. We would prefer an alarm for cross-track error.
SeaClear II
SeaClear II is the cheapest of the bunch. Its free. It supports NOAA raster charts in BSB/KAP format and NOS/GOS charts. Chart images in BMP or PNG graphics formats can be manually indexed for use. All acceptable chart formats must be installed using MapCal II, a separate utility program supplied with SeaClear II. As Maptech PCX or RML formats are not supported, the charts used in this review (which took place onboard a cruising boat in the Mediterranean Sea) were made from screen captures of Maptech PCX charts using a screen-capture program downloaded from a SeaClear II website link and calibrated with MapCal II. While that process is a bit tedious, almost any chart image can ultimately be used with SeaClear II.
The documentation comes in a separate file (PDF format) and includes considerable guidance for creating and calibrating charts for use with SeaClear II. We received one response to multiple e-mail queries, but the documentation does caution that not all e-mail questions will be answered.
SeaClear II is unique in many aspects, but once you understand the logic involved, operation of the program is fairly straightforward. The software has some advanced features, including NMEA output for an autopilot, automatic trip logging, uploading to supported GPS receivers (which first requires downloading free software via links at the SeaClear website), and AIS target display capability.
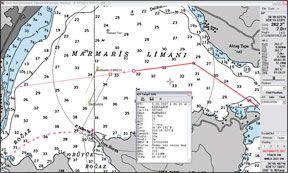
Two serial ports can be set up to monitor an AIS and GPS receiver simultaneously. GPS target information is available from a list of targets within the boats range, and a symbol appears on the chart where the selected target is located, based on the target vessels transmitted position. The targets track is not shown, but a course predictor line indicates the direction of travel; if received, the vessels name is attached to the target image.
Controls for moving about the chart are well orchestrated, and the chart can be centered at the cursor location by double-clicking it or moved by dragging it with the mouse. The zoom level at the cursor position is controlled by the mouse wheel (if available) or via a pop-up menu activated by right-clicking on the chart. When the automatic tracking mode is activated, SeaClear II automatically selects the best chart available and centers it on the vessels position. The next available chart is loaded automatically when needed, based on the GPS input position.
Routes are created by opening the route editor and double-clicking on the chart to place waypoints that are automatically incorporated into the route as you add them. The route editor works smoothly, and a route along with a list of waypoints, bearings, and distances can be created quite quickly. Our testers only major complaint was that waypoints are not assigned a default name, so each new waypoint requires manually typing in a name.
When the GPS signal is lost, a continuous chime sounds and the GPS position panel turns red. It then changes to a red Dead Reckoning (DR) position panel that continues to advance the vessels symbol using the last known speed and heading information. Should you lose connection for a while, the DR heading and speed can be adjusted. User marks, called positions, can be created, labeled, and stored, but are not loaded automatically when the chart is loaded.
SeaClear IIs MOB function can be accessed only by right-clicking on the chart and selecting “MARK MOB” on the resulting pop-up menu. When activated, a display shows the lat/long of the MOB position with constantly updated bearing and distance to this location, but the position cannot be used as a waypoint to provide steering guidance. There is no anchor alarm. To activate the visual AIS closest point of approach (CPA) alarms, or sound alarms for cross-track requires setting it in the .INI file (described in manual). Without this setup, the cross-track display line turns red if the maximum error is exceeded, and the navigation panel turns red when a waypoint is passed.
Bottom Line:
Its free, and functional, so whats not to like? Some of our essential features like alarms were not implemented as well as they might have been, but it was nice to see AIS support included. Since Maptech RML and PCX charts arent supported, that makes it harder to find compatible raster charts outside of U.S. waters. Creating charts from other sources is certainly possible, but fairly labor-intensive.
SOBvMAX
Software-On-Board or SOB is, in many respects, a different breed of software. Although its initial cost is just $58, it requires C-Map vector charts, so you could wind up paying at least $250 to be able to use it for navigation. Still, that is half the price of MaxSea 12, the only C-Map-compatible software that we tested last year.
SOBvMax is designed to work with C-Map NT and the relatively new C-Map Max versions (from which it derives its name). The C-Map digital chart packages cost about $200, so the relative cost of this program will depend upon what charts you need. Some sailors may already have C-Map chart cartridges for their C-Map-compatible chartplotter, so they will need only the C-Map card reader ($150). Practical Sailor evaluated SOBvMax using C-Map NT charts on disc. Although the software touts its compatibility with touch-screen displays, we did not test this feature.
SOBvMax has a long list of advanced features, including support for acquiring and displaying GRIB weather data that is overlaid directly on the chart (still in beta testing), a very complete AIS implementation to display received target tracking information. This has a unique graphic display of the CPA with alarms; a computer voice that can be activated to relay information about course, speed, and other parameters for the visually impaired; radar target data overlaid on the chart; automatic logging; GPS upload (NMEA format only); autopilot support; and a built-in selection of user-selectable search patterns for MOB situations. SOBvMax also includes an impressive list of user-programmable alarms and graphic wind plots, if NMEA wind data is available.
C-Map cartography includes tidal and current data, aerial photos of harbors, and detailed information on marinas and chart objects, all of which can be accessed via the charting software. Vector charts eliminate the need to change charts to view more detail or larger areas, thus allowing a relatively seamless chart viewer. The ability to display charts from different perspectives allows an oblique view of the chart display, and virtually all C-Map charts use the commonly used WGS-84 datum.
Right-clicking on a chart object opens a window to display more detailed information. Lights can be animated to flash in their correct color, and light sectors are flashed in their respective colors. The chart handling, as you would expect with vector chart displays, is excellent.
SOBvMax documentation includes a “QuickStart card” and a comprehensive manual in PDF format. The F1 function key brings up a window that details mouse functions and keyboard shortcuts, provides access to both the “quick start card” and the manual as well as offering to display an onscreen keyboard, if desired.
SOBvMaxs nomenclature can be confusing. SOBvMax refers to a waypoint on a route as a “turning point,” and uses the term “waypoint” to refer to what is usually called a “mark” or “user mark.” When a user mark or waypoint is placed, a configuration page can be opened to do just about anything to it: delete it; edit its lat/long position; insert labels or store notes for later use; change the color and appearance; set an alarm zone around it; navigate directly to it; or designate it as a mark to be loaded automatically whenever SOB starts.
Panning the chart is easy and can be handled in a variety of ways, using either the keyboard or the mouse. Testers found the combination of centering and scrolling with the mouse wheel to be a quick and convenient way to pan.
Routes can be entered or edited with the mouse cursor when the “Route” button on the toolbar is toggled on. Clicking on the chart places the waypoint&emdash;”turning point” in SOB&emdash;at the cursor, adds it to the waypoint list, and draws a line in one operation. This goes very quickly when moving about the chart with the mouse scroll wheel. The route is edited by dragging waypoints with the mouse or double-clicking on the waypoint to reveal a popup menu that offers a choice of deleting the waypoint, inserting a new one after it, converting the next leg to a great circle route, or viewing details via the route list.
Trip planning can be done by clicking on the chart display with the “Range & Bearing Line” (RBL) button depressed. Up to five points can be selected to display heading and distance between each point. Cumulative distance is not shown, but as long as the RBL button is toggled on, range and bearing from the vessels position is also shown to each point.
The latest version of SOBvMax incorporates a large selection of user configurable alarms, including those available in most other programs (GPS input is lost, maximum cross-track error set is exceeded, arrival at a turning point, for example), and some other more innovative ones (new RADAR or AIS target acquired, distress message received via AIS or DSC, the maximum or minimum set depth exceeded, a dangerous course is set).
SOBvMax can also sound an alarm if it receives an MOB signal from the Raymarine “LifeTag” system or a DSC distress message. Several options for configuring the alert warning are offered, including sending an e-mail via Microsoft Outlook, issuing a vocal alert or sounding an audio alarm.
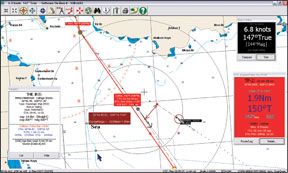
SOBvMax incorporates something quite close to the ideal MOB function. In fact, when the prominent MOB button on the main toolbar is clicked, a series of automatic actions take place. First, an MOB waypoint is set at the vessels current position. Next, the UTC time is recorded and navigation directly to the waypoint is activated (also available to the autopilot). Then, an alarm zone with a radius of 100 feet is set. The arrival alarm is turned on to alert searchers when nearing the MOB position. The navigation window opens to display continuously updated range, bearing, ETA, and steering guidance to the MOB position. And finally, the course line function is activated to continuously display a line between the vessels symbol and the MOB position.
Bottom Line:
SOBvMax is clearly the Best Choice in this comparison. In terms of features and performance, it is far superior to the others reviewed, but it is also a different, vector-chart breed. However, it qualifies as cheap software only if you already have compatible C-Map charts.
Conclusions
With any kind of charting software, stability and basic functionality come first and foremost. Software programs that lock up, shut themselves down, or crash the entire operating system are&emdash;at best&emdash;frustrating and undependable. Software that overloads the computer can be just as bad.
All four of these software packages can be downloaded for free, and Practical Sailor encourages readers to try any navigation software before you buy.
Given its plurality of convenient features, and its designers clear interest in facilitating MOB operations, the SOBvMax is hands down our Best Choice. At $53, its also the least expensive of the three products that are sold for a profit. The other&emdash;the freeware SeaClear II&emdash;is sufficiently functional to garner our Budget Buy designation.
Keep in mind that if you don’t yet have C-Map charts and plan on cruising widely, then youll likely spend the same amount on charts for SOBvMax as you would for Maptechs Chart Navigator Pro ($500, http://www.maptech.com/) or Rose Point Navigation Coastal Explorer ($400, http://www.rosepointnav.com/), our Best Choices for Windows users. (Mac users get a great bargain with MacENC, http://www.gpsnavx.com/, $140.) Both Chart Navigator Pro and Coastal Explorer come bundled with a complete set of U.S. charts (Maptech includes 3-D charts, as well), and will work with a wider range of both vector and raster charts, including free NOAA vector charts. So, unless you cruise in a C-Map-only world&emdash;and many cruisers do&emdash;these programs may be a better bargain.


